simplicity.online
  • Solutions
  • Portfolio
  • Company
    AboutReviewsTeamCommunity
  • Articles
  • Support
    Simplicity RMSSociusEmailContact
simplicity.online
  • Solutions
        • Web

        • Website Design
        • SEO
        • Live Chat
        • Ecommerce
        • Online Order Fraud
        • Design

        • Branding
        • Logo Design
        • Graphic Design
        • Illustration
        • Productivity

        • File Label Software
        • Records Management Software
        • RFID Software
        • Project Management Software
        • Document Scanning and Management
        • Reseller Program
        • Digital Marketing

        • Mobile Apps
        • Digital Ads
        • Online Review Management
        • Social Media Management
        • Local Business Listings
        • Copywriting
  • Portfolio
  • Company
        • About
        • We simplify business through technology.

        • Reviews
        • Our Customer Feedback

        • Team
        • Our team has decades of experience.

        • Community
        • We are proud to “Simply Serve” in our community.

  • Articles
  • Support
        • Simplicity RMS
        • Records Management System

        • Socius
        • Business and Project Management

        • Email
        • Workplace Email

        • Contact
        • Connect with Us

Gantt Charts

Home » Socius » Gantt Charts

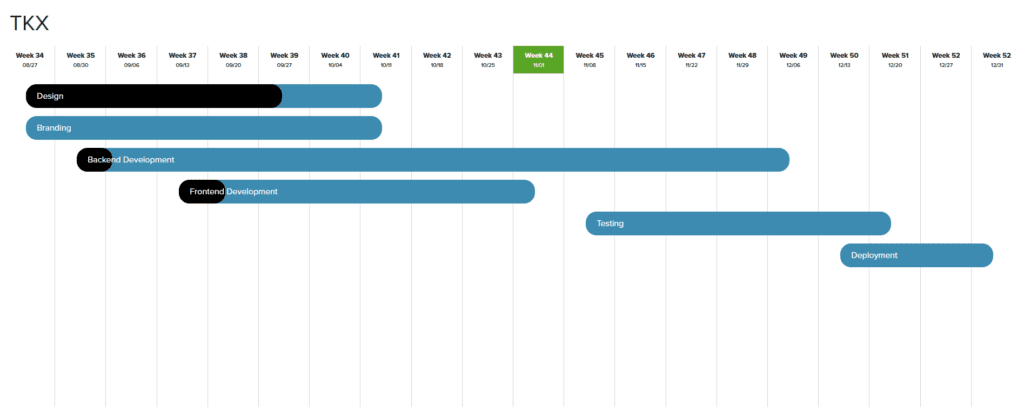
A Gantt chart is a type of bar chart that illustrates a project schedule. Socius generates Gantt charts based on task lists within a project. These task lists will create bars on the chart, and the timeline is generated based on the earliest start date of a task within that list. The latest due date will mark the end of the timeline. A secure link to the chart for your project is on the project sidebar under Reports. To share the chart, simply use the sidebar button and copy the secure link in your browser’s address bar.

Requirements

To populate your Gantt chart, you must provide Socius with task lists containing tasks with Start date and Due on fields filled out. The chart uses a weekly time interval to display the task lists.

Functionality

Once the tasks and checklists are checked off, Socius will begin automatically calculating completion percentage for each task list. The current week is marked in green. Black bars represent the completion percentage visually. Hover over each bar to see a tooltip with the completion percentage number.

Need support?

Let us know

© 2023 simplicity.online. All Rights Reserved. Privacy Policy
Website by Simplicity.Online